TL;DR
Relying on gut feeling leads to premature scaling. But relying on a single metric creates fake certainty.
Product market fit benchmarks are directional — low churn or early revenue does not guarantee PMF. You must triangulate demand using retention, engagement, and sales pull.
The meaning of a benchmark changes based on your product type. A daily workflow tool cannot be judged by the same metrics as a once-a-year compliance product.
Use benchmarks alongside practical validations like concierge pilots to test real behavior.
The ultimate signal of PMF is qualitative: acquiring customers starts to feel noticeably easier, like moving with the wind rather than pushing against it.
Product market fit benchmarks are quantitative thresholds — such as retention rates, engagement scores, and activation metrics — that help founders validate whether a product has achieved sustainable market demand.
The Fake Certainty of a Single Metric
Founders often want a clean answer to a messy question: "Are we there yet?" Under pressure to scale, it is tempting to look at one good number and decide the product-market fit definition has been met.
This leads to dangerous assumptions. A B2B founder might say, "Our churn is incredibly low, so we definitely have product-market fit." But measuring product-market fit solely through churn is a naive oversimplification. Low churn can mean customers love you. It can also mean they are locked into annual contracts, they haven't had a renewal moment yet, or they simply forgot they are paying for it.
The same applies to revenue. Hitting $10k MRR feels like a milestone, but it is not necessarily product-market fit. Early revenue can come from founder-led hustle, one-off relationships, or brute-force sales work you cannot repeat.
Conversely, a failed first outbound campaign does not prove you lack market demand. Channels take time to learn. Weak early outbound results might just mean your targeting, message, or list was wrong.
While benchmarks are useful, they become dangerous when you turn them into a fake verdict. Instead, use them to triangulate true demand.
The Product-Type Context Matrix
Before you look at a benchmark table, you have to frame the numbers around your ideal customer's real usage pattern. Founders overcomplicate benchmarks by treating the table as the final answer, without adjusting for natural frequency.
A product bought or used once a year cannot be judged like a daily operational system. If you try to force a daily active user (DAU) metric onto an annual procurement tool, you will think your product is failing when it is actually doing exactly what the buyer hired it to do.
Product Type | Natural Frequency | What Strong Engagement Looks Like |
|---|---|---|
Daily Workflow Tool (e.g., Slack, Figma) | Multiple times per day | High DAU/MAU ratio; users keep the tab open; quick time to value. |
Weekly Operational System (e.g., Payroll, Analytics) | 1-3 times per week | Deep sessions when logged in; clear task completion; high weekly retention. |
Occasional/Annual Tool (e.g., Compliance, Tax) | Monthly, Quarterly, or Annually | Low active usage, but high willingness to pay when the specific trigger event occurs; high renewal at the next trigger event. |
How to Read These Benchmarks
Product market fit benchmarks are directional indicators, not absolute pass/fail grades. Their accuracy depends heavily on your ACV (Annual Contract Value), contract terms, usage frequency, ideal customer profile, and sales motion. Use these ranges as comparison bands. A healthy B2B SaaS company will hit promising or strong signals across multiple categories.
When you evaluate these numbers, remember that how to find product-market fit signals involves looking across the whole customer journey.
B2B Benchmark Comparison Bands
We've broken down the key benchmarks by metric so you can evaluate them in context.
Annual Gross Logo Retention
What it measures: Percentage of customers who renew their contracts.
Ranges: Weak (< 70%), Promising (80% - 85%), Strong (> 90%).
Use when: Measuring core product value and dissatisfaction.
Activation Rate
What it measures: Percentage of signups that reach a core value milestone.
Ranges: Weak (< 15%), Promising (20% - 30%), Strong (> 40%).
Use when: Testing onboarding effectiveness and initial promise.
Source: General B2B SaaS benchmark (illustrative)
WAU/MAU Ratio
What it measures: Weekly active users divided by monthly active users.
Ranges: Weak (< 25%), Promising (40% - 50%), Strong (> 60%).
Use when: Tracking habit formation for frequent-use products.
Source: General B2B SaaS benchmark (illustrative)
(Note: As noted in Lenny's Newsletter PMF Frameworks, sales should feel less like convincing and more like taking orders. Use qualitative frameworks alongside these numbers.)
Practical Framework: Validating the Numbers
If you want to know what your dashboard is really saying, you have to look beyond it. Use this diagnostic flow to test your metrics:
High retention? Check engagement. Are they staying because they use it, or because they forgot to cancel?
High engagement? Check willingness to pay. Are they using it because it is free, or does it solve a painful enough problem that they will open their wallet?
High revenue? Check repeatability. Was that revenue won through a repeatable channel, or through founder favors?
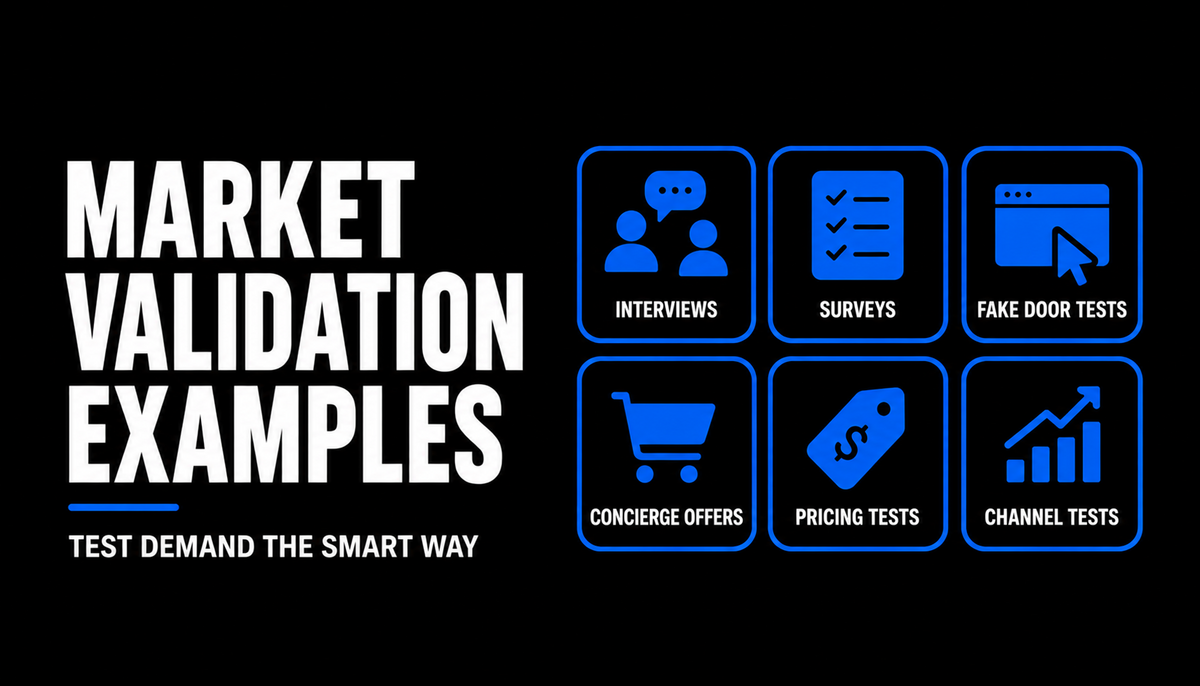
To test these signals early, run a small paid pilot or concierge test with real buyers before you spend months building software. This allows you to test product-market fit rapidly.
For example, before building a complex automation platform, you could sell a 14-day manual pilot to a small group of buyers. You deliver the service manually behind the scenes. The real test is what happens when the 14 days end. If a strong segment (e.g., 40%) of those pilot users immediately ask to buy the ongoing subscription, you have validated the demand. This is a practical example of a strong signal, not a universal benchmark. Only then do you build the automation.
Founders love asking customers, "What do you think about it?" or "How do you like it?" Those questions produce polite lies (a core principle of The Mom Test). The better question is not whether they liked it, but what they did before, during, and after they had the option to use it.
The Ultimate Check: Moving With the Wind
The strongest signal of product-market fit is not hitting a generic SaaS benchmark in isolation. It is a qualitative shift in momentum.
When you find true demand, customer acquisition starts to feel noticeably easier. It feels like the market is pulling the product out of your hands, rather than you having to push it onto reluctant buyers. You see shorter sales cycles, faster yeses, organic referrals, and buyers asking you for the next step.
You can use benchmark tables to make sure your business model is sound, but the ultimate answer is usually felt in the market. You are no longer fighting the wind; you are moving with it.
FAQ
What are good product market fit benchmarks for B2B SaaS?
Good benchmarks depend heavily on your product's natural usage frequency. Generally, promising signals include gross logo retention above 80%. Always adjust these ranges for your specific contract terms and buyer profile.
Do product-market-fit benchmarks prove we have PMF?
No, they are inputs, not a verdict. Use benchmark frameworks to triangulate your position. The stronger test is whether demand starts pulling: attracting customers and users becomes noticeably easier. Do not reduce PMF to churn alone; frame retention and engagement ranges as comparison bands, then validate them against actual customer behavior.
Why shouldn't we just ask customers if they would pay for the product?
Directly asking customers "What do you think?" or "Would you buy this?" forces polite lies instead of actionable insights. Study their past performance and behavior. Try to understand why they behaved in a certain manner when they had a problem, and look for evidence of actual purchase attempts or workarounds.
Can a failed outbound campaign prove we lack product-market fit?
No. A weak outbound campaign does not yet prove a lack of product-market fit or justify giving up on an audience. Channels take time to master. A failed campaign might just mean your targeting, message, or list was wrong, not that the market rejects your product.