TL;DR:
A product-market fit survey helps identify users who depend on your product. It cannot prove fit on its own.
Poll only active users who completed your core workflow in the past two to four weeks. Inactive signups add polite noise to your data.
Anchor on the Sean Ellis question: “How would you feel if you could no longer use this product?” Focus on respondents who answer “very disappointed.”
Pair the anchor question with inquiries about past habits, real alternatives, and costly workarounds instead of asking whether people like your tool.
An overall score below 40% often hides an enthusiastic niche. Group answers by job title, workflow, and problem frequency before changing product direction.
True product-market fit appears as organic market pull. Combine survey responses with contract renewals, retention curves, and verified willingness to pay.
Why Early PMF Metrics Often Mislead
Early-stage founders often hunt for a single metric to confirm product-market fit.
Some look at low churn on a cheap plan. Yet low churn often reflects billing inertia from customers who forgot a small monthly charge. Others run a paid ad test, which only reveals whether a headline gets clicks. It cannot show whether users need the software. Other founders trust positive feedback on demo calls, only to watch those prospects vanish when asked to sign an agreement.
A survey will not resolve that uncertainty with an undeniable pass-fail score. Treating it as a proof machine leads to debating percentages instead of improving the core offer.
The real job of this survey is diagnostic. It acts as an operational filter. It filters out casual signups and polite compliments. Instead, it highlights the small group of early adopters whose routine breaks without your tool. Their answers show what value you deliver, what tools you replace, and which customer profile justifies your focus. Survey data provides one layer of evidence, but it does not replace direct customer interviews, sales velocity, or proven willingness to pay.
Who Gets the Survey (Audience Qualification)
Sending a survey to your entire user database distorts your data.
When you email newsletter subscribers, dormant accounts, or signups who quit during setup, you collect irrelevant opinions. Casual users usually report they would be “somewhat disappointed” or “not disappointed.” They often request cosmetic additions, like dark mode, or complex integrations your active buyers do not need.
Filter your list strictly before sending:
Included: Users who completed your primary value action at least twice in the past fourteen to thirty days.
Included: Customers who used the product recently enough that the workflow remains fresh in memory.
Excluded: Signups who bounced during onboarding or never reached initial setup.
Excluded: Accounts that have been inactive for more than thirty days.
Excluded: Friends, family, and advisors whose answers reflect personal goodwill rather than commercial need.
Forty thoughtful responses from people who rely on your tool teach you far more than hundreds of replies from casual signups.
PMF Survey Questions: The Copy-Paste Template and Sean Ellis Test Questions
Send this six-question survey to active users who completed your core workflow in the past two to four weeks. It helps you identify who relies on your product, what tools they would switch back to, and which customer profile justifies your attention.
1. How would you feel if you could no longer use [Product Name]?
   [ ] Very disappointed
   [ ] Somewhat disappointed
   [ ] Not disappointed (it isn't really that useful)
   [ ] N/A - I no longer use it

2. What would you likely use as an alternative if [Product Name] were no longer available?
   [ ] I would go back to my previous tool or method: [Open text]
   [ ] I would look for another dedicated software: [Open text]
   [ ] I wouldn't replace it with anything
   [ ] Other: [Open text]

3. What is the primary benefit you receive from [Product Name]?
   [Open text]

4. What type of person or team do you think would benefit most from [Product Name]?
   [Open text]

5. How often do you run into the specific problem [Product Name] solves?
   [ ] Daily
   [ ] Multiple times per week
   [ ] A few times a month
   [ ] Rarely / only during specific seasons

6. What role or job title best describes you, and how large is your team?
   Role: [Open text]
   Team size: [Single select: 1-5, 6-25, 26-100, 100+]
Why Each Question Exists
Question 1 (The Anchor): Popularized by growth advisor Sean Ellis on his official site, this question gauges user dependence on your product. Focus your analysis on respondents who select “very disappointed.”
Question 2 (The Real Competitor): This question uncovers your actual competition. It reveals whether you replace a dedicated software tool, an internal spreadsheet, or inaction.
Question 3 (The Core Value): Lets users describe your value in their own words. The exact phrases your happiest customers write here can inform your website messaging and sales conversations.
Question 4 (The Ideal Customer Profile): Shows who users believe gains the most value. Early adopters often describe their own role and operational context with remarkable clarity.
Question 5 (Frequency of Pain): Distinguishes daily, acute headaches from minor problems that occur once a quarter.
Question 6 (Context and Segmentation): Provides the metadata required to segment responses by title, team size, and department.
How to Read the Responses: Segment First, Score Second
Sean Ellis popularized a standard benchmark: if 40% or more of respondents say they would be “very disappointed” without your product, you have strong validation. Treat this 40% threshold as a directional benchmark rather than an absolute pass-fail grade. An aggregate score can easily hide where true product-market fit lives inside your user base.
Consider an illustrative example of a B2B compliance tool with 140 survey responses. Across the entire user base, only 21% answered “very disappointed.” On the surface, the business looks stalled. When the founders segmented responses by job role and audit timing, a clear pattern emerged:
General operations managers: 8% answered “very disappointed.” They logged in once a month and saw limited value.
FinTech operations directors handling active SOC 2 audits: 68% answered “very disappointed.” For them, the alternative was fifteen hours of manual spreadsheet work every week.
The product was effective, but the customer focus was too broad. By narrowing positioning to teams preparing for active audits, the founders found immediate traction. If you are assessing retention patterns alongside enterprise indicators, review our guide on B2B product-market fit benchmarks to see how early contract durability and renewal rates should behave.
The Response Cohort Matrix
Use this matrix to organize your analysis:
Cohort | What Their Answers Tell You | How to Handle Their Feedback |
|---|---|---|
Very Disappointed | Your core ideal customer profile (ICP). They encounter the problem regularly and feel the pain directly. | Protect their workflow first. Build capabilities that make their routine faster, and use their exact language in your messaging. |
Somewhat Disappointed | Users who like the concept but find the tool slightly misaligned, missing an integration, or solving a secondary issue. | Listen only to the subset whose role and workflow match your “very disappointed” group. Ignore requests that pull your product into an unrelated category. |
Not Disappointed | Users who lack an urgent problem, picked the wrong tool, or do not feel the operational pain. | Deprioritize their feature requests. Building what casual users request often creates bloated software that fails to solve core problems well. |
As demonstrated in the Superhuman PMF survey method, focusing on your strongest supporters while ignoring users who will never love the product is the most reliable way to maintain focus.
Spotting Workarounds and Failure Costs
When reading open-ended survey answers, distinguish polite praise from operational reliance.
Founders often highlight positive comments like “Love the clean interface” or “Great product, would love an extra export option.” These comments are polite distractions. A customer who compliments your design can still churn next month if the tool does not solve an expensive operational problem.
Look for concrete descriptions of past behavior rather than general opinions:
Vague opinion: “It saves us some time during the week.”
Actionable operational signal: “Before this, our lead engineer spent three hours every Monday manually reviewing API logs because our internal script broke whenever cloud providers updated their schemas.”
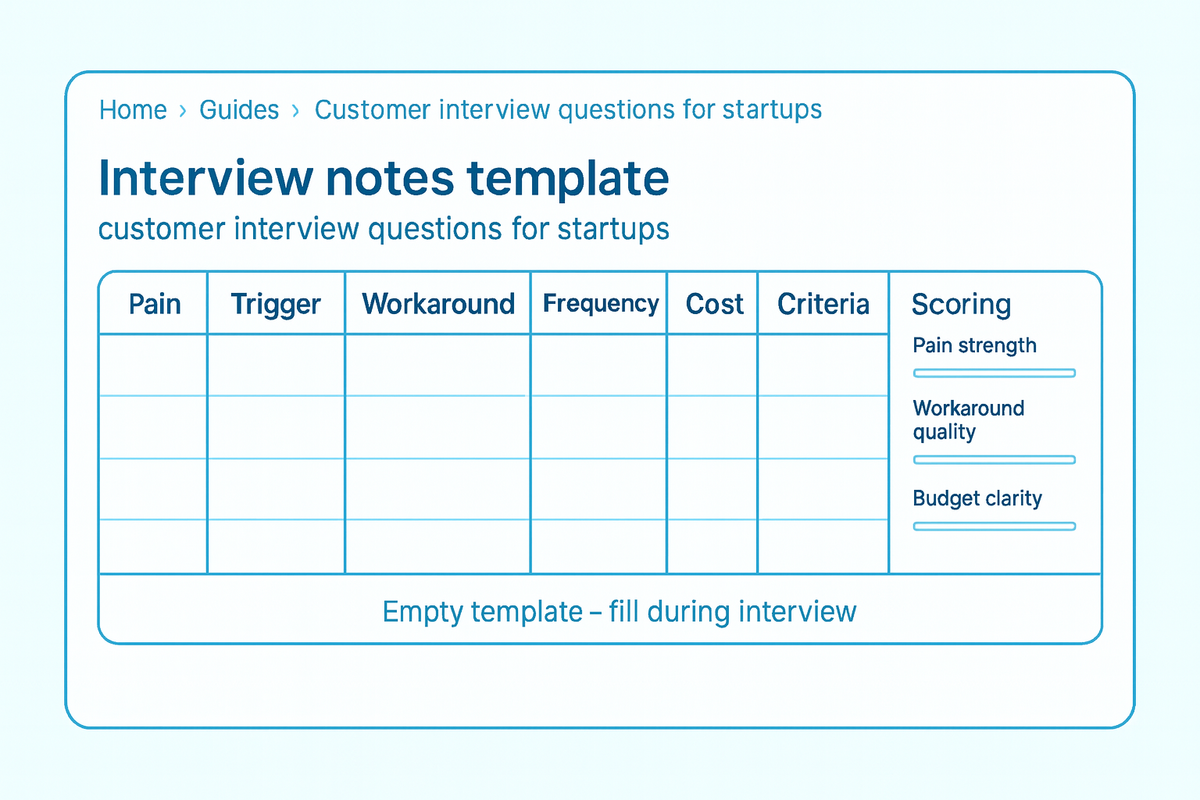
The second response reveals the trigger (Monday log reviews), the previous workaround (a brittle script), the buyer role (engineering lead), and the cost of failure (lost developer hours).
When reviewing what your “very disappointed” cohort writes, examine two specific factors:
How often does the pain occur? A problem encountered daily or weekly builds natural product habits. An issue that happens once a year rarely justifies an ongoing subscription.
What does failure cost? If your software stops working, does someone miss a delivery deadline, lose revenue, or face a compliance fine? Or do they simply finish the task manually in ten minutes?
Software that replaces expensive, frustrating, or risky workarounds generates strong organic retention.
Connecting Survey Data to Real Market Demand
A survey score provides directional guidance, but it cannot stand alone. To confirm whether your business has genuine traction, connect survey feedback to actual customer behavior.
Beyond survey percentages and usage charts, pay attention to the sales process itself. In his analysis of early validation signals, Lenny Rachitsky notes that true product-market fit brings a noticeable change in momentum.
Acquiring customers stops feeling like pushing against resistance. Instead, it begins to feel like moving with demand at your back. Prospects understand the offer without extended slide decks, onboarding conversion rises, and qualified inbound leads arrive because users recommend the tool to peers.
If your survey score looks strong but every closed account requires steep discounts and hands-on founder intervention, your distribution channel remains unproven. Review our guide on finding product-market fit signals to verify whether your survey results are backed by organic customer pull, referral velocity, and clear willingness to pay.
Use this qualified survey data as defensible evidence before committing capital to aggressive hiring, paid acquisition, or investor milestone reporting. When your “very disappointed” responses concentrate in a tight, high-urgency niche, you have the proof you need to back funding or scaling decisions.
FAQ
How do I know if this survey means we actually reached product-market fit?
Treat the survey as one diagnostic layer rather than an automatic verdict. A high score suggests that you found enthusiastic early adopters, but true product-market fit shows up as market pull: acquiring customers becomes noticeably easier, with faster sales cycles and natural word-of-mouth referrals. Use survey follow-ups to understand past behavior and costly workarounds rather than collecting polite praise.
What is the Sean Ellis test question?
The Sean Ellis test question is a single survey prompt: “How would you feel if you could no longer use [Product Name]?” Users choose between “Very disappointed,” “Somewhat disappointed,” “Not disappointed,” or “N/A - I no longer use it.” It gauges how dependent active users are on your product.
Is 40% very disappointed a product-market-fit benchmark?
The 40% threshold is a directional heuristic, not an absolute proof point. Reaching 40% or higher among qualified active users indicates that your product solves a meaningful problem for that group. However, it does not guarantee your target market is large enough or that customer acquisition costs will scale sustainably.
How many PMF survey responses do I need?
For an early-stage B2B product, thirty to fifty responses from active, qualified users are typically sufficient to identify clear patterns. You are looking for recurring workflows, familiar alternatives, and common job titles rather than statistically rigorous survey samples.
Who should receive a product-market-fit survey?
Send the survey only to active users who completed your primary value action at least twice in the past fourteen to thirty days. Do not send it to your entire contact list, dormant accounts, or visitors who dropped out during onboarding.